Annual report
UK Wave and Sea Temperature Almanac 2015
A comparison of hourly-normalized observations from UK coastal and marine wave stations. The report uses only sufficiently complete station-years for each comparison and publishes the station evidence alongside every chart.
Data snapshot updated . Published 21 August 2026.
Executive summary
- In Southwest England, the regional monthly mean was highest in December at 2.06 m and lowest in September at 0.73 m. Other regions follow their own seasonal pattern.
- The largest accepted significant wave height was 12.5 m at Cormorant AWS in January. A sustained sequence around the peak supports it as a storm event rather than an isolated spike.
- The highest monthly mean sea temperature was 18.6 °C at Pevensey Bay; the lowest was 4.1 °C at Chapel Point.
- The Copernicus gridded sea-surface temperature anomaly for UK and nearby waters was -0.16 °C against the 1991–2020 monthly climatology.
- Automated checks examined 1,177,475 values at wave-eligible stations and excluded 8,182, or 0.69%.
- Station-years represented
- 40
- Wave-comparison stations
- 26
- Temperature stations
- 21
- Minimum day coverage
- 95%
Regional seasonal wave patterns
Combining all UK stations would mix different wave climates and overstate regions with more buoys. Each panel therefore shows one region. A monthly value first summarizes one accepted value per station per UTC hour, then gives every eligible station in that region equal weight. The shaded band averages the station-level 10th and 90th percentiles using the same equal weighting. Every panel uses the same zero-based vertical scale, so line heights can be compared directly between regions.
Region links open the current wave-buoy map. If a historical region no longer exists, the map shows all regions.
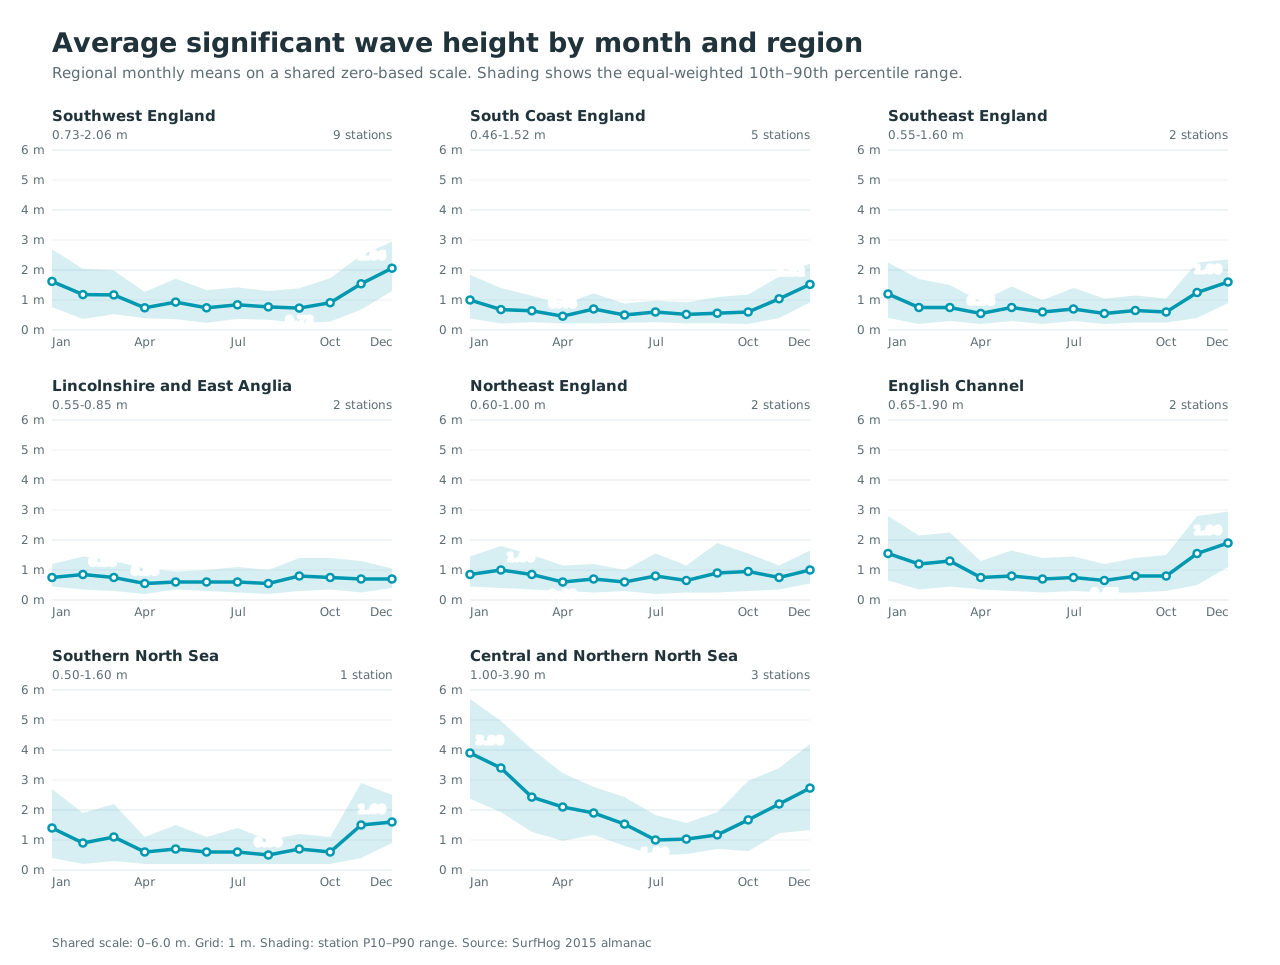
View chart values for average significant wave height by month and region
| Region | Month | Mean significant wave height | 10th–90th percentile range | Stations |
|---|---|---|---|---|
| Southwest England | January | 1.62 m | 0.76–2.69 m | 9 |
| Southwest England | February | 1.18 m | 0.37–2.04 m | 9 |
| Southwest England | March | 1.17 m | 0.53–1.98 m | 9 |
| Southwest England | April | 0.74 m | 0.39–1.27 m | 9 |
| Southwest England | May | 0.93 m | 0.36–1.71 m | 9 |
| Southwest England | June | 0.74 m | 0.24–1.33 m | 9 |
| Southwest England | July | 0.84 m | 0.37–1.42 m | 9 |
| Southwest England | August | 0.77 m | 0.34–1.30 m | 9 |
| Southwest England | September | 0.73 m | 0.23–1.39 m | 9 |
| Southwest England | October | 0.91 m | 0.28–1.73 m | 9 |
| Southwest England | November | 1.54 m | 0.68–2.49 m | 9 |
| Southwest England | December | 2.06 m | 1.30–2.94 m | 9 |
| South Coast England | January | 1.00 m | 0.38–1.84 m | 5 |
| South Coast England | February | 0.68 m | 0.22–1.40 m | 5 |
| South Coast England | March | 0.64 m | 0.26–1.14 m | 5 |
| South Coast England | April | 0.46 m | 0.22–0.86 m | 5 |
| South Coast England | May | 0.70 m | 0.22–1.22 m | 5 |
| South Coast England | June | 0.50 m | 0.24–0.88 m | 5 |
| South Coast England | July | 0.60 m | 0.26–0.98 m | 5 |
| South Coast England | August | 0.52 m | 0.22–0.92 m | 5 |
| South Coast England | September | 0.56 m | 0.22–1.10 m | 5 |
| South Coast England | October | 0.60 m | 0.20–1.18 m | 5 |
| South Coast England | November | 1.04 m | 0.40–1.78 m | 5 |
| South Coast England | December | 1.52 m | 0.92–2.22 m | 5 |
| Southeast England | January | 1.20 m | 0.40–2.25 m | 2 |
| Southeast England | February | 0.75 m | 0.20–1.70 m | 2 |
| Southeast England | March | 0.75 m | 0.30–1.50 m | 2 |
| Southeast England | April | 0.55 m | 0.20–0.95 m | 2 |
| Southeast England | May | 0.75 m | 0.30–1.45 m | 2 |
| Southeast England | June | 0.60 m | 0.20–1.00 m | 2 |
| Southeast England | July | 0.70 m | 0.30–1.40 m | 2 |
| Southeast England | August | 0.55 m | 0.20–1.05 m | 2 |
| Southeast England | September | 0.65 m | 0.25–1.15 m | 2 |
| Southeast England | October | 0.60 m | 0.25–1.05 m | 2 |
| Southeast England | November | 1.25 m | 0.40–2.25 m | 2 |
| Southeast England | December | 1.60 m | 0.90–2.35 m | 2 |
| Lincolnshire and East Anglia | January | 0.75 m | 0.45–1.20 m | 2 |
| Lincolnshire and East Anglia | February | 0.85 m | 0.35–1.45 m | 2 |
| Lincolnshire and East Anglia | March | 0.75 m | 0.30–1.30 m | 2 |
| Lincolnshire and East Anglia | April | 0.55 m | 0.20–1.05 m | 2 |
| Lincolnshire and East Anglia | May | 0.60 m | 0.35–0.95 m | 2 |
| Lincolnshire and East Anglia | June | 0.60 m | 0.30–1.00 m | 2 |
| Lincolnshire and East Anglia | July | 0.60 m | 0.25–1.10 m | 2 |
| Lincolnshire and East Anglia | August | 0.55 m | 0.20–1.00 m | 2 |
| Lincolnshire and East Anglia | September | 0.80 m | 0.30–1.40 m | 2 |
| Lincolnshire and East Anglia | October | 0.75 m | 0.35–1.40 m | 2 |
| Lincolnshire and East Anglia | November | 0.70 m | 0.25–1.30 m | 2 |
| Lincolnshire and East Anglia | December | 0.70 m | 0.40–1.05 m | 2 |
| Northeast England | January | 0.85 m | 0.45–1.45 m | 2 |
| Northeast England | February | 1.00 m | 0.40–1.80 m | 2 |
| Northeast England | March | 0.85 m | 0.35–1.50 m | 2 |
| Northeast England | April | 0.60 m | 0.30–1.15 m | 2 |
| Northeast England | May | 0.70 m | 0.25–1.20 m | 2 |
| Northeast England | June | 0.60 m | 0.30–1.00 m | 2 |
| Northeast England | July | 0.80 m | 0.20–1.55 m | 2 |
| Northeast England | August | 0.65 m | 0.25–1.15 m | 2 |
| Northeast England | September | 0.90 m | 0.25–1.90 m | 2 |
| Northeast England | October | 0.95 m | 0.30–1.55 m | 2 |
| Northeast England | November | 0.75 m | 0.35–1.15 m | 2 |
| Northeast England | December | 1.00 m | 0.55–1.65 m | 2 |
| English Channel | January | 1.55 m | 0.65–2.80 m | 2 |
| English Channel | February | 1.20 m | 0.35–2.15 m | 2 |
| English Channel | March | 1.30 m | 0.45–2.25 m | 2 |
| English Channel | April | 0.75 m | 0.35–1.30 m | 2 |
| English Channel | May | 0.80 m | 0.30–1.65 m | 2 |
| English Channel | June | 0.70 m | 0.25–1.40 m | 2 |
| English Channel | July | 0.75 m | 0.30–1.45 m | 2 |
| English Channel | August | 0.65 m | 0.25–1.20 m | 2 |
| English Channel | September | 0.80 m | 0.25–1.40 m | 2 |
| English Channel | October | 0.80 m | 0.30–1.50 m | 2 |
| English Channel | November | 1.55 m | 0.50–2.80 m | 2 |
| English Channel | December | 1.90 m | 1.10–2.95 m | 2 |
| Southern North Sea | January | 1.40 m | 0.40–2.70 m | 1 |
| Southern North Sea | February | 0.90 m | 0.20–1.90 m | 1 |
| Southern North Sea | March | 1.10 m | 0.30–2.20 m | 1 |
| Southern North Sea | April | 0.60 m | 0.20–1.10 m | 1 |
| Southern North Sea | May | 0.70 m | 0.20–1.50 m | 1 |
| Southern North Sea | June | 0.60 m | 0.20–1.10 m | 1 |
| Southern North Sea | July | 0.60 m | 0.20–1.40 m | 1 |
| Southern North Sea | August | 0.50 m | 0.20–1.00 m | 1 |
| Southern North Sea | September | 0.70 m | 0.20–1.20 m | 1 |
| Southern North Sea | October | 0.60 m | 0.20–1.10 m | 1 |
| Southern North Sea | November | 1.50 m | 0.40–2.90 m | 1 |
| Southern North Sea | December | 1.60 m | 0.90–2.50 m | 1 |
| Central and Northern North Sea | January | 3.90 m | 2.37–5.70 m | 3 |
| Central and Northern North Sea | February | 3.40 m | 1.93–4.97 m | 3 |
| Central and Northern North Sea | March | 2.43 m | 1.27–4.03 m | 3 |
| Central and Northern North Sea | April | 2.10 m | 0.97–3.23 m | 3 |
| Central and Northern North Sea | May | 1.90 m | 1.17–2.77 m | 3 |
| Central and Northern North Sea | June | 1.53 m | 0.80–2.43 m | 3 |
| Central and Northern North Sea | July | 1.00 m | 0.50–1.83 m | 3 |
| Central and Northern North Sea | August | 1.03 m | 0.53–1.57 m | 3 |
| Central and Northern North Sea | September | 1.17 m | 0.70–1.93 m | 3 |
| Central and Northern North Sea | October | 1.67 m | 0.63–2.97 m | 3 |
| Central and Northern North Sea | November | 2.20 m | 1.23–3.40 m | 3 |
| Central and Northern North Sea | December | 2.73 m | 1.33–4.20 m | 3 |
Regional comparison
Each range bar shows the regional 10th–90th percentile bounds, with the annual mean marked in gold. Regions with one station describe that station alone. Offshore and nearshore regions should not be compared as equivalent measures of surf conditions.
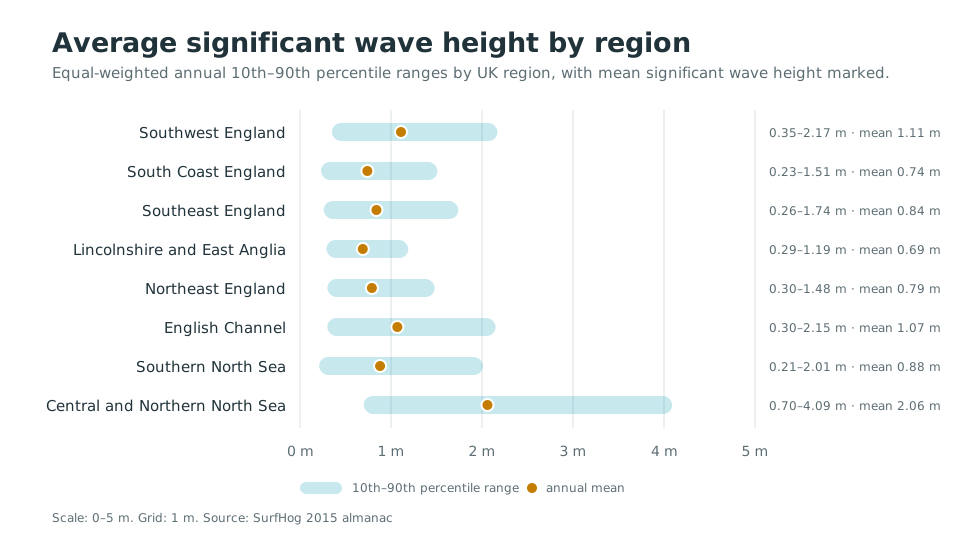
View chart values for average significant wave height by region
| Region | Annual mean | 10th–90th percentile range | Stations |
|---|---|---|---|
| Southwest England | 1.11 m | 0.35–2.17 m | 9 |
| South Coast England | 0.74 m | 0.23–1.51 m | 5 |
| Southeast England | 0.84 m | 0.26–1.74 m | 2 |
| Lincolnshire and East Anglia | 0.69 m | 0.29–1.19 m | 2 |
| Northeast England | 0.79 m | 0.30–1.48 m | 2 |
| English Channel | 1.07 m | 0.30–2.15 m | 2 |
| Southern North Sea | 0.88 m | 0.21–2.01 m | 1 |
| Central and Northern North Sea | 2.06 m | 0.70–4.09 m | 3 |
Largest accepted height by region
| Region | Station | Largest height |
|---|---|---|
| Southwest England | Bideford Bay | 11.3 m |
| South Coast England | West Bay | 6.2 m |
| Southeast England | Pevensey Bay | 3.8 m |
| Lincolnshire and East Anglia | Happisburgh | 3.8 m |
| Northeast England | Newbiggin | 4.8 m |
| English Channel | Ch. Lightship | 6.2 m |
| Southern North Sea | Greenwich | 4.7 m |
| Central and Northern North Sea | Cormorant AWS | 12.5 m |
Sea temperatures
Monthly means are used for the range comparison. This reduces the influence of a single bad sensor reading while preserving the annual cycle. The chart shows the 15 eligible stations with the highest annual mean; all eligible stations remain in the supporting table.
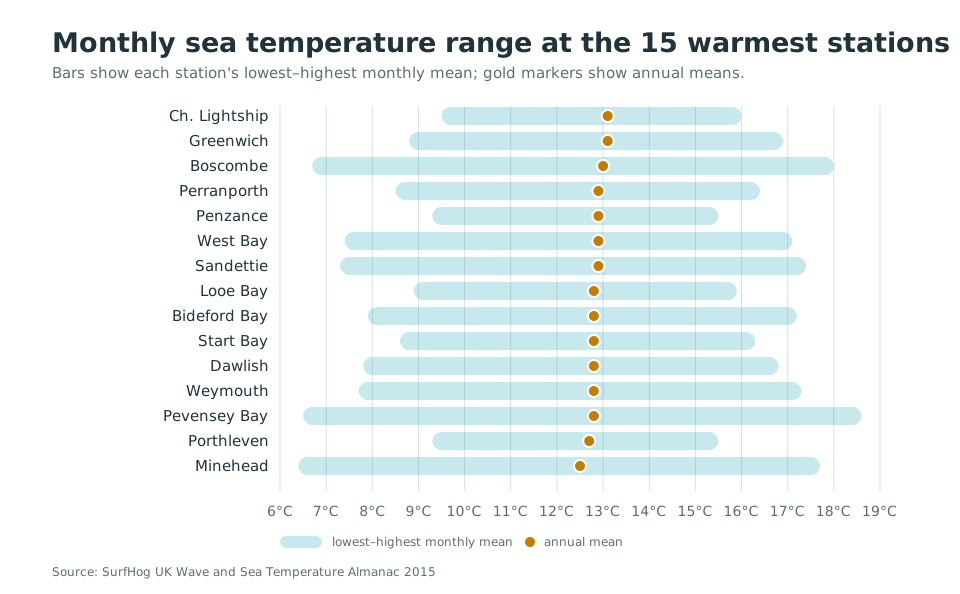
View chart values for monthly sea temperature range at the 15 warmest stations
| Station | Lowest monthly mean | Annual mean | Highest monthly mean |
|---|---|---|---|
| Ch. Lightship | 9.5 °C | 13.1 °C | 16.0 °C |
| Greenwich | 8.8 °C | 13.1 °C | 16.9 °C |
| Boscombe | 6.7 °C | 13.0 °C | 18.0 °C |
| Perranporth | 8.5 °C | 12.9 °C | 16.4 °C |
| Penzance | 9.3 °C | 12.9 °C | 15.5 °C |
| West Bay | 7.4 °C | 12.9 °C | 17.1 °C |
| Sandettie | 7.3 °C | 12.9 °C | 17.4 °C |
| Looe Bay | 8.9 °C | 12.8 °C | 15.9 °C |
| Bideford Bay | 7.9 °C | 12.8 °C | 17.2 °C |
| Start Bay | 8.6 °C | 12.8 °C | 16.3 °C |
| Dawlish | 7.8 °C | 12.8 °C | 16.8 °C |
| Weymouth | 7.7 °C | 12.8 °C | 17.3 °C |
| Pevensey Bay | 6.5 °C | 12.8 °C | 18.6 °C |
| Porthleven | 9.3 °C | 12.7 °C | 15.5 °C |
| Minehead | 6.4 °C | 12.5 °C | 17.7 °C |
Copernicus sea-temperature anomaly
Why does a 1 °C sea-temperature anomaly matter?
A degree can sound small because air temperature changes quickly. The ocean is different: water needs a great deal of energy to warm, and it releases that heat slowly. The IPCC estimates that ocean warming accounted for 91% of the heating of the climate system between 2006 and 2018.
One cubic metre of seawater
about 1.1 kWh per 1 °C
One square kilometre, 1 m deep
about 1.1 GWh per 1 °C
That second amount is roughly the energy used by a 1 kW household appliance running continuously for 127 years. Watts describe the rate of energy use; kilowatt-hours describe the total energy. The calculation uses seawater's approximate specific heat capacity of 4,000 joules per kilogram per degree Celsius.
Stored ocean heat expands seawater and raises sea level. A warmer starting point also makes damaging marine heatwaves more likely and can stress ecosystems and fisheries. These effects become more widespread with each additional increment of warming.
This is an illustration of scale, not an estimate of the heat in the chart area: a sea-surface anomaly does not mean the whole upper metre warmed uniformly. The report compares one year in UK and nearby waters with its 1991–2020 monthly baseline. It is not the global long-term warming threshold, and individual years also include natural variability.
Read more from the IPCC climate science assessment, IPCC assessment of ocean impacts and the seawater heat-capacity reference.
This separate gridded view shows how warm or cool the wider sea surface was relative to the 1991–2020 monthly climatology. Positive values mean warmer than the baseline for that calendar month. The analysis covers valid ocean cells from 48–62°N and 12°W–4°E and does not alter the observed buoy findings above.
- Annual SST anomaly
- -0.16 °C
- Largest warm anomaly
- Nov +0.4 °C
- Largest cool anomaly
- Aug -0.76 °C
- Gridded minus buoy median
- -0.19 °C
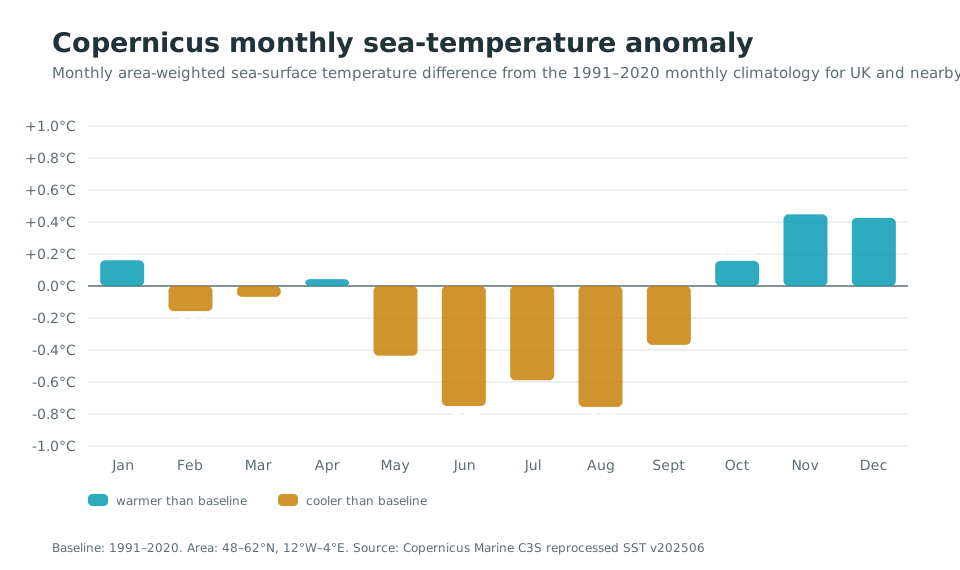
View chart values for copernicus monthly sea-temperature anomaly
| Month | Anomaly | 2015 gridded mean | 1991–2020 mean | Valid days |
|---|---|---|---|---|
| Jan | +0.16 °C | 9.09 °C | 8.93 °C | 31 |
| Feb | -0.16 °C | 8.18 °C | 8.34 °C | 28 |
| Mar | -0.07 °C | 8.10 °C | 8.17 °C | 31 |
| Apr | +0.04 °C | 8.80 °C | 8.76 °C | 30 |
| May | -0.44 °C | 9.82 °C | 10.26 °C | 31 |
| Jun | -0.75 °C | 11.65 °C | 12.40 °C | 30 |
| Jul | -0.59 °C | 13.70 °C | 14.29 °C | 31 |
| Aug | -0.76 °C | 14.41 °C | 15.16 °C | 31 |
| Sept | -0.37 °C | 13.99 °C | 14.35 °C | 30 |
| Oct | +0.16 °C | 12.99 °C | 12.84 °C | 31 |
| Nov | +0.45 °C | 11.67 °C | 11.22 °C | 30 |
| Dec | +0.43 °C | 10.32 °C | 9.89 °C | 31 |
The gridded field had 100.0% daily coverage for this calculation. At 21 eligible buoy sites, 252 matched station-months had a mean absolute difference of 0.25 °C. The nearest valid ocean cells were no more than 3.0 km from a buoy.
Source: Copernicus Marine C3S reprocessed SST dataset C3S-GLO-SST-L4-REP-OBS-SST_202506, DOI 10.48670/moi-00169.
Coverage and quality control
A station needs observations on at least 95% of days and accepted measurements in at least 90% of annual hours to enter that metric's comparison. Stations below the threshold are still listed for transparency.
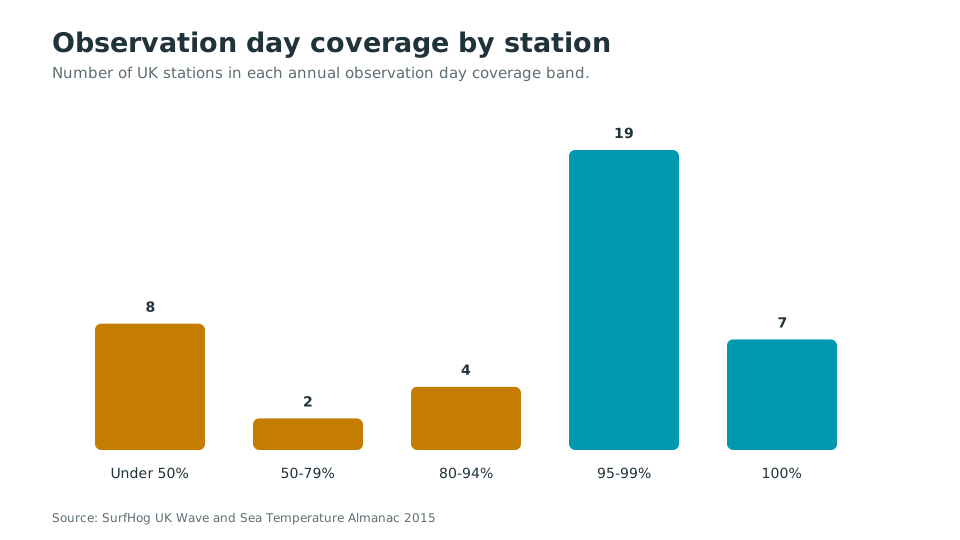
View chart values for observation day coverage by station
| Day coverage band | Stations |
|---|---|
| Under 50% | 8 |
| 50-79% | 2 |
| 80-94% | 4 |
| 95-99% | 19 |
| 100% | 7 |
Largest station-month peaks
These are the largest accepted monthly maxima among eligible stations. Repeated entries for a station reflect separate stormy months, not duplicate observations.
| Month | Station | Region | Maximum |
|---|---|---|---|
| January | Cormorant AWS | Central and Northern North Sea | 12.5 m |
| December | Cormorant AWS | Central and Northern North Sea | 12.0 m |
| November | Bideford Bay | Southwest England | 11.3 m |
| January | Anasuria AWS | Central and Northern North Sea | 10.1 m |
| January | Beryl A AWS | Central and Northern North Sea | 9.8 m |
| December | Beryl A AWS | Central and Northern North Sea | 9.3 m |
| November | Cormorant AWS | Central and Northern North Sea | 8.3 m |
| February | Cormorant AWS | Central and Northern North Sea | 8.3 m |
Supporting station table
This table contains every station-year considered. A dash means the metric was unavailable. “Included” indicates that the station met the day and metric-hour thresholds for that comparison.
| Station | Region | Day coverage | Wave status | Wave hours | Mean Hs | Median Hs | Annual Hs P10–P90 | Maximum Hs | Temperature status | Annual temperature | Monthly mean range | Excluded values |
|---|---|---|---|---|---|---|---|---|---|---|---|---|
| Wave HubLegacy SurfHog archive | Southwest England | 0.0%0 days | Below threshold | 00.0% | Not available | Not available | Not available | Not available | Below threshold | Not available | Not available | 00.00% |
| SevenstonesLegacy SurfHog archive | Southwest England | 99.0%361 days | Included | 7,99791.3% | 2.07 m | 1.71 m | 0.70–3.90 m | 8.0 m | Below threshold | 12.2 °C | 9.5 °C to 16.3 °C | 3881.00% |
| PerranporthLegacy SurfHog archive | Southwest England | 95.0%347 days | Included | 8,17693.3% | 1.68 m | 1.46 m | 0.58–3.11 m | 6.5 m | Included | 12.9 °C | 8.5 °C to 16.4 °C | 420.10% |
| Port IsaacSource recorded on station page | Southwest England | 0.0%0 days | Below threshold | 00.0% | Not available | Not available | Not available | Not available | Below threshold | Not available | Not available | 00.00% |
| PenzanceLegacy SurfHog archive | Southwest England | 97.0%353 days | Included | 8,27494.5% | 0.70 m | 0.55 m | 0.21–1.43 m | 4.6 m | Included | 12.9 °C | 9.3 °C to 15.5 °C | 2140.60% |
| PorthlevenLegacy SurfHog archive | Southwest England | 97.0%353 days | Included | 8,19393.5% | 1.34 m | 1.07 m | 0.40–2.71 m | 6.8 m | Included | 12.7 °C | 9.3 °C to 15.5 °C | 1020.30% |
| Looe BayLegacy SurfHog archive | Southwest England | 97.0%353 days | Included | 8,34095.2% | 0.94 m | 0.76 m | 0.30–1.95 m | 5.2 m | Included | 12.8 °C | 8.9 °C to 15.9 °C | 1820.50% |
| MineheadChannel Coastal Observatory, Legacy SurfHog archive | Southwest England | 100.0%365 days | Included | 8,65298.8% | 0.58 m | 0.52 m | 0.18–1.10 m | 2.7 m | Included | 12.5 °C | 6.4 °C to 17.7 °C | 1520.20% |
| Bideford BayLegacy SurfHog archive | Southwest England | 97.0%353 days | Included | 8,32995.1% | 1.34 m | 1.07 m | 0.37–2.74 m | 11.3 m | Included | 12.8 °C | 7.9 °C to 17.2 °C | 880.30% |
| Start BayLegacy SurfHog archive | Southwest England | 96.0%351 days | Included | 8,25894.3% | 0.73 m | 0.58 m | 0.24–1.43 m | 3.6 m | Included | 12.8 °C | 8.6 °C to 16.3 °C | 1830.60% |
| DawlishChannel Coastal Observatory | Southwest England | 100.0%365 days | Included | 8,74799.9% | 0.58 m | 0.46 m | 0.18–1.13 m | 3.2 m | Included | 12.8 °C | 7.8 °C to 16.8 °C | 2400.30% |
| West BayLegacy SurfHog archive | South Coast England | 97.0%353 days | Included | 8,33495.1% | 0.94 m | 0.70 m | 0.27–2.07 m | 6.2 m | Included | 12.9 °C | 7.4 °C to 17.1 °C | 1570.50% |
| WeymouthLegacy SurfHog archive | South Coast England | 95.0%346 days | Included | 8,13792.9% | 0.49 m | 0.40 m | 0.18–0.94 m | 2.7 m | Included | 12.8 °C | 7.7 °C to 17.3 °C | 1390.40% |
| BoscombeLegacy SurfHog archive | South Coast England | 97.0%353 days | Included | 8,38795.7% | 0.61 m | 0.49 m | 0.21–1.19 m | 3.1 m | Included | 13.0 °C | 6.7 °C to 18.0 °C | 1490.40% |
| ChesilChannel Coastal Observatory | South Coast England | 100.0%365 days | Included | 8,74299.8% | 1.10 m | 0.82 m | 0.30–2.32 m | 6.2 m | Included | 12.4 °C | 7.6 °C to 17.0 °C | 1530.20% |
| Sandown BayChannel Coastal Observatory | South Coast England | 99.0%363 days | Included | 8,69899.3% | 0.55 m | 0.43 m | 0.18–1.04 m | 2.8 m | Included | 12.4 °C | 6.7 °C to 18.1 °C | 1100.20% |
| SeafordLegacy SurfHog archive | Southeast England | 94.0%344 days | Below threshold | 7,75388.5% | 0.91 m | 0.64 m | 0.21–2.07 m | 5.1 m | Below threshold | 12.6 °C | 6.5 °C to 18.3 °C | 1080.30% |
| FolkestoneLegacy SurfHog archive | Southeast England | 93.0%339 days | Below threshold | 7,97791.1% | 0.61 m | 0.49 m | 0.21–1.19 m | 2.6 m | Below threshold | 12.8 °C | 6.3 °C to 18.1 °C | 890.30% |
| Pevensey BayLegacy SurfHog archive | Southeast England | 95.0%348 days | Included | 8,24794.1% | 0.85 m | 0.67 m | 0.27–1.71 m | 3.8 m | Included | 12.8 °C | 6.5 °C to 18.6 °C | 1060.30% |
| Bracklesham BayChannel Coastal Observatory | Southeast England | 100.0%365 days | Included | 8,75099.9% | 0.82 m | 0.64 m | 0.24–1.77 m | 3.7 m | Below threshold | 13.3 °C | 7.6 °C to 18.3 °C | 1530.20% |
| Chapel PointChannel Coastal Observatory | Lincolnshire and East Anglia | 100.0%365 days | Included | 8,759100.0% | 0.73 m | 0.67 m | 0.30–1.22 m | 3.5 m | Included | 11.3 °C | 4.1 °C to 17.6 °C | 2120.30% |
| HappisburghChannel Coastal Observatory | Lincolnshire and East Anglia | 100.0%365 days | Included | 8,759100.0% | 0.64 m | 0.52 m | 0.27–1.16 m | 3.8 m | Included | 11.3 °C | 4.2 °C to 17.9 °C | 1560.20% |
| NewbigginLegacy SurfHog archive | Northeast England | 96.0%350 days | Included | 8,26894.4% | 0.85 m | 0.70 m | 0.30–1.65 m | 4.8 m | Included | 9.7 °C | 6.1 °C to 12.8 °C | 1300.40% |
| ScarboroughLegacy SurfHog archive | Northeast England | 73.0%265 days | Below threshold | 6,22171.0% | 1.04 m | 0.88 m | 0.40–1.83 m | 8.0 m | Below threshold | 10.0 °C | -5.0 °C to 13.3 °C | 1270.50% |
| WhitbyLegacy SurfHog archive | Northeast England | 76.0%278 days | Below threshold | 6,53974.6% | 0.91 m | 0.73 m | 0.34–1.74 m | 9.5 m | Below threshold | 9.5 °C | 5.9 °C to 13.5 °C | 1520.60% |
| HornseaChannel Coastal Observatory | Northeast England | 100.0%365 days | Included | 8,74699.8% | 0.73 m | 0.64 m | 0.30–1.31 m | 3.8 m | Included | 10.3 °C | 5.6 °C to 14.8 °C | 2330.30% |
| Morecambe BayLegacy SurfHog archive | Northwest England | 93.0%341 days | Below threshold | 5,47562.5% | 0.73 m | 0.55 m | 0.15–1.58 m | 3.9 m | Below threshold | 10.7 °C | 5.6 °C to 16.8 °C | 1100.50% |
| AberporthLegacy SurfHog archive | Wales | 0.0%0 days | Below threshold | 00.0% | Not available | Not available | Not available | Not available | Below threshold | Not available | Not available | 00.00% |
| PembrokeLegacy SurfHog archive | Wales | 0.0%0 days | Below threshold | 00.0% | Not available | Not available | Not available | Not available | Below threshold | Not available | Not available | 00.00% |
| Rhyl FlatsLegacy SurfHog archive | Wales | 0.0%0 days | Below threshold | 00.0% | Not available | Not available | Not available | Not available | Below threshold | Not available | Not available | 00.00% |
| K7Legacy SurfHog archive | West Scotland | 92.0%335 days | Below threshold | 7,80189.1% | 2.77 m | 2.71 m | 0.00–5.49 m | 12.2 m | Below threshold | 10.8 °C | 9.0 °C to 12.4 °C | 1,8525.40% |
| JerseyLegacy SurfHog archive | English Channel | 0.0%0 days | Below threshold | 00.0% | Not available | Not available | Not available | Not available | Below threshold | Not available | Not available | 00.00% |
| SandettieLegacy SurfHog archive | English Channel | 96.0%350 days | Included | 8,29694.7% | 0.67 m | 0.49 m | 0.21–1.40 m | 3.5 m | Included | 12.9 °C | 7.3 °C to 17.4 °C | 2880.70% |
| Ch. LightshipLegacy SurfHog archive | English Channel | 99.0%361 days | Included | 8,37295.6% | 1.46 m | 1.19 m | 0.40–2.90 m | 6.2 m | Included | 13.1 °C | 9.5 °C to 16.0 °C | 70.00% |
| GreenwichLegacy SurfHog archive | Southern North Sea | 99.0%361 days | Included | 8,28694.6% | 0.88 m | 0.61 m | 0.21–2.01 m | 4.7 m | Included | 13.1 °C | 8.8 °C to 16.9 °C | 1700.40% |
| Anasuria AWSLegacy SurfHog archive | Central and Northern North Sea | 96.0%350 days | Included | 8,34095.2% | 1.04 m | 0.00 m | 0.00–2.99 m | 10.1 m | Below threshold | 8.4 °C | 6.9 °C to 12.7 °C | 4,31311.70% |
| Beryl A AWSLegacy SurfHog archive | Central and Northern North Sea | 96.0%350 days | Included | 8,31895.0% | 2.41 m | 2.01 m | 1.01–4.39 m | 9.8 m | Below threshold | Not available | Not available | 910.30% |
| Brent "A" AWSLegacy SurfHog archive | Central and Northern North Sea | 0.0%0 days | Below threshold | 00.0% | Not available | Not available | Not available | Not available | Below threshold | Not available | Not available | 00.00% |
| Cormorant AWSLegacy SurfHog archive | Central and Northern North Sea | 96.0%350 days | Included | 8,28294.5% | 2.74 m | 2.41 m | 1.10–4.91 m | 12.5 m | Below threshold | Not available | Not available | 240.10% |
| Eider AWSLegacy SurfHog archive | Central and Northern North Sea | 0.0%0 days | Below threshold | 00.0% | Not available | Not available | Not available | Not available | Below threshold | Not available | Not available | 00.00% |
Method and limitations
The analysis uses the newest stored 2015 annual snapshot for each station in the defined UK coastal and marine regions. Measurements are normalized to one accepted value per station per UTC hour without filling gaps. Regional and monthly comparisons weight eligible stations equally. Temperatures in the findings are monthly means, while wave peaks are accepted individual significant wave heights.
Offshore and nearshore stations are not directly comparable as measures of surf conditions. Coverage does not guarantee sensor accuracy, and automated checks can miss sustained faults. Source availability and later corrections can change a rebuilt annual snapshot. See the full data and methodology notes for source terms, hard limits, unit conversions and the observed-versus-calculated distinction.
Copernicus anomalies are calculated independently from the buoy summaries. Daily 0.05° analysed SST is averaged across valid ocean grid cells using cosine-latitude area weights, then summarized to monthly means. Each monthly anomaly is measured against the matching 1991–2020 monthly climatology, and the annual anomaly is the mean of those 12 differences. The rectangular 48–62°N, 12°W–4°E window is a reproducible analysis area, not a legal or forecast-region boundary. Buoy comparisons use the nearest valid ocean grid cell within 20 km, so coastal position and grid-cell footprint can produce genuine differences.
Cite and share this report
Suggested citation: SurfHog (2026), “UK Wave and Sea Temperature Almanac 2015”, data updated 20 August 2026, https://www.surfhog.co.uk/reports/uk-wave-sea-temperature-almanac-2015
Cite the original observation providers as well as SurfHog when using a specific station finding. Provider and reuse details are listed in the data and methodology page.